
Section 5: Rebuilding the nation · Chapter 22
Energy at cost
Reading time: 14 minutes 30 seconds
In this section
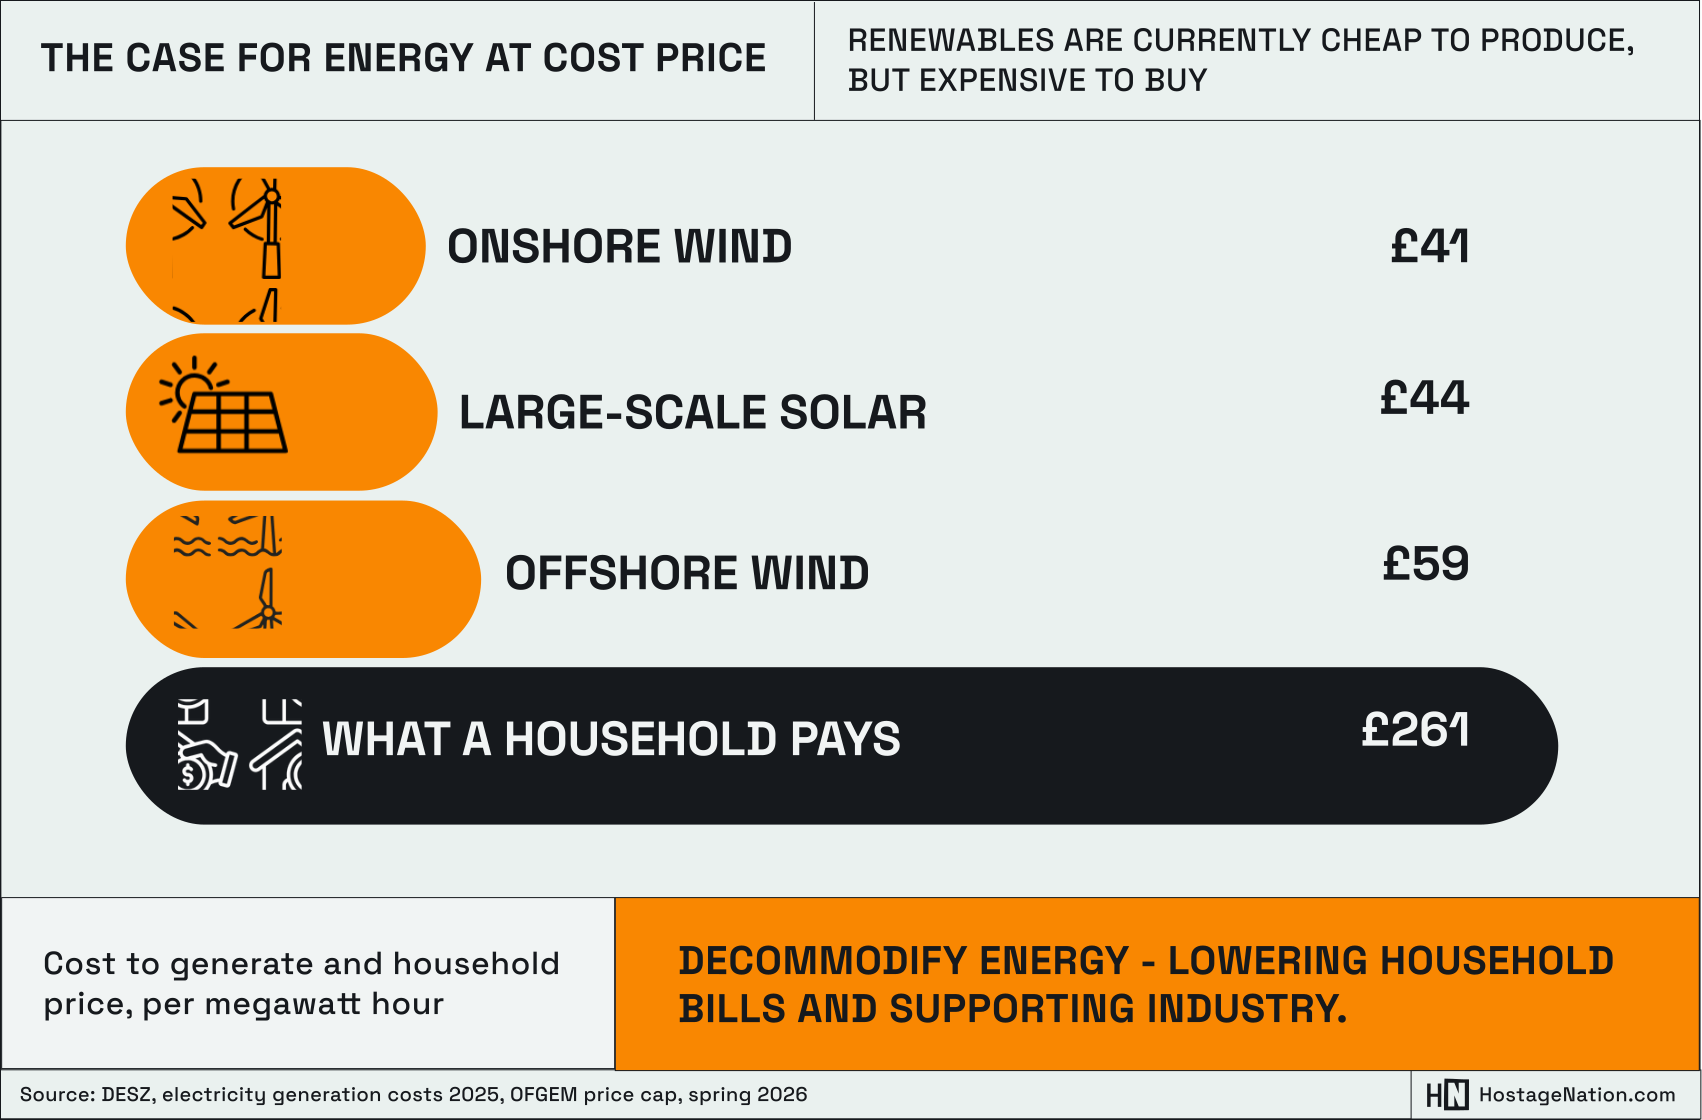
A British household pays 26.11p for a unit of electricity. In the units the industry uses, that is £261 a megawatt hour.
The government’s own estimate of what it costs to generate a megawatt hour from a new offshore wind farm is £59. Onshore wind, £41. Large-scale solar, £44.1
Cheap to generate. Expensive to finance. Sold at the price of gas regardless.
Take the bill apart
Under the spring 2026 cap, a typical household electricity bill was £875. Wholesale power – what the supplier paid to buy the electricity – was £333 of that. Network charges, the pylons and cables and substations, were £214. The remaining £328 was levies, supplier costs, metering, bad debt and VAT.2
So a quarter of the bill is the wires. Building and maintaining that has a real cost. But the private, often overseas based owners take a large share. Public ownership gets its own chapter.3
The third slice moved this year. In April 2026 the government took two environmental and social schemes off energy bills and funded them through general taxation instead. Bills fell by about £150 because of a political choice. Worth remembering, next time you are told that sort of thing cannot be done.
The price of the last gas plant
That leaves wholesale, the largest slice and the strangest.
Britain buys electricity in half-hourly auctions. The cheapest generation is taken first, then the next cheapest, until demand is met. Whatever the final unit costs sets the price paid to everyone in that half hour. On most days the final unit comes from a gas plant.
So a wind farm generating at £41 is paid whatever gas costs that afternoon. In 2022 that was several hundred pounds a megawatt hour. Britain has built one of the largest offshore wind fleets on earth and the price of electricity still tracks a commodity traded in Rotterdam.
If you want to run energy as a market, where capital gets a return, this works. Most electricity markets in the world work this way. If you want to provide abundant, cheap energy, it doesn’t.4
This system is just a political decision. It can be changed.
The cost of the money
The second failure is not about the market. It is about who pays for the concrete.
A wind farm or solar plant is almost all upfront cost and almost no running cost. You build it, and after that the fuel is free. Which means the price of the electricity is mostly the price of the money.
At present, wind farms compete for capital on global markets. So if a fund manager can make more money from a share buyback or a rental portfolio, they’ll put their money there. By using off-market financing described in section 4, the state does not need to beat that rate of return. It needs the lights on, the factories running, and the bills down. And it collects around 40p in the pound of everything it spends, which no private investor does.5
Finance a wind farm that way and the same turbine in the same water produces cheaper electricity. Nothing physical changes. We just don’t pay international finance large profits.
Existing contracts still need to be honoured. Legal certainty is worth more than the saving, and a state that tears up its own agreements pays for it in every deal it signs afterwards. The gain arrives as those contracts expire, and from everything built after that.
How big is the job
Great Britain uses around 290 terawatt hours of electricity a year.
Take the gas out of heating and the petrol out of driving, and electric heat pumps and vehicles replace it. To hit net-zero, the government’s energy system planners estimated demand of between 705 and 797 terawatt hours by 2050. Roughly two and a half times what we use now.
They increased the estimate by 17% in a single year, partly because the operator assumed Britain would scale back insulation.6
Which is the argument of this whole report, sitting in one statistic. Insulation is not a virtuous extra alongside the grid. It is the difference between building a system for 800 terawatt hours and building one for something closer to 580 TWh.
“Every house retrofitted is a power station nobody has to build, a cable nobody has to lay, and a battery nobody has to buy.”
Storage
Demand peaks on cold winter evenings, when solar produces nothing. Wind usually covers it. But the same high pressure that brings the hardest frost brings the stillest air, so the coldest week can also be the calmest. On a glorious, breezy summer day we’re generating far more than we use. Storage is the answer.
We should build, own, and operate our generation infrastructure directly, using the off-market finance described in section 4.
Offshore wind at scale, in the shallow North Sea, where the wind resource is among the best on earth and the supply chain already exists.
Solar on roofs. Supermarkets, warehouses, distribution sheds, car parks, and every suitable house the Retrofit Blitz reaches while the scaffolding is already up.7 Power generated on a roof needs no transmission line, which matters more than it sounds, because transmission is the binding constraint.
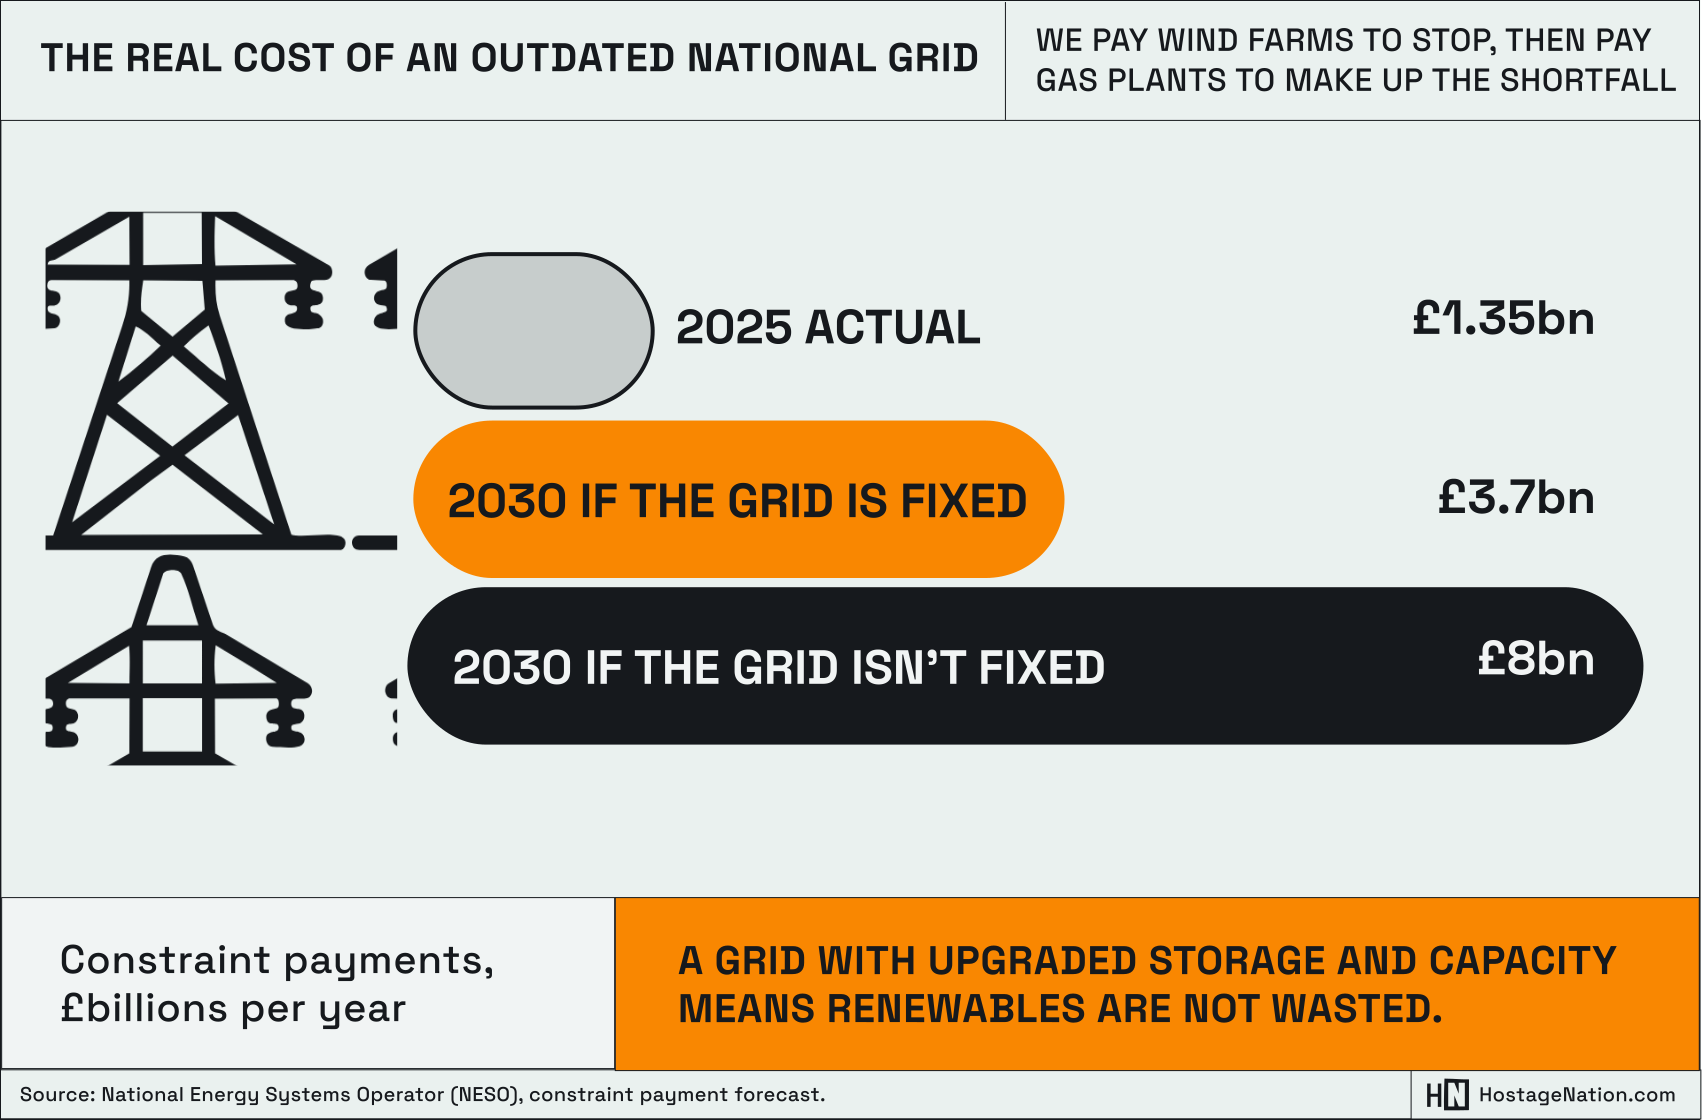
That constraint is expensive. When the wind blows hard in Scotland and the cables south cannot carry the power, we pay the wind farms to stop. Then we pay gas plants in England to make up the shortfall. In 2025 that came to around £1.35 billion — a third of a billion to switch turbines off, and roughly a billion to switch gas on. The system operator expects it to reach £8 billion a year by 2030 if the network is not fixed, and £2.8 to £3.7 billion a year even if it is.8
We are paying twice not to use something we have already built.
Storage needs different technologies for different timescales.
Hours. Lithium-ion, already sitting in homes and substations across the country. Sodium-ion is coming on to the market now: cheaper, safer, built from salt, iron and aluminium rather than lithium and cobalt. They are heavier for the same energy, which matters in a car but not at all in a cupboard that never moves.
Days. Iron-air batteries. Heavier again, slower, and they lose roughly half of what goes in. They are also cheap enough that the loss is beside the point, because what goes in is the electricity we currently pay to throw away. They rust to discharge and reverse the rust to charge.
Weeks. Green hydrogen, electrolysed from water using power nobody needs at the time, stored industrially. It is useful as the fuel and feedstock for steel, ammonia and heavy haulage. Also as a seasonal reserve for exceptional calm, dark weather.
None of it is speculative. All three are being built now.9
Some materials we import. China makes raw silicon more cheaply than anyone and holds more capacity than the world can absorb, which keeps the price low. Buying wafers from China is sensible.
The value is not in the wafer. Most of the cost of a solar installation is the surveyor, the scaffolder, the roofer and the electrician, and none of that can be offshored, because the roof is in Coventry. The high-margin part is the electronics – inverters, power conversion, grid synchronisation – and Britain has the aerospace and automotive supply chains to build them. What Britain has never had is an order book long enough to justify building the factory.10
That is what a twenty-year pipeline is for.
The fitters and engineers who built and maintained the gas system are still needed to build this new system. The transition would be planned, and they’ll still have good jobs. Chapter 27 sets out how that Just Transition is handled. It has to be a commitment, not a footnote.
We have done this before
Britain converted its entire domestic energy system once already, inside a decade, and most people have forgotten it happened.
North Sea gas would not burn in appliances built for town gas. So between 1967 and 1977 the state-owned gas industry converted or replaced around 40 million appliances across 14 million homes and businesses. Region by region. Fitters trained in advance, every appliance surveyed, replacement parts ordered before conversion day, a showroom in every town to handle the complaints. At its peak, 2.3 million properties a year. Around 100,000 people worked on it.
Denis Rooke, who went on to run British Gas, called it perhaps the greatest peacetime operation in the nation’s history.11
In 1963 seven in ten British homes were heated by coal. By 1977 nearly half had gas central heating, and rooms that had been unusable between October and March became part of the house.
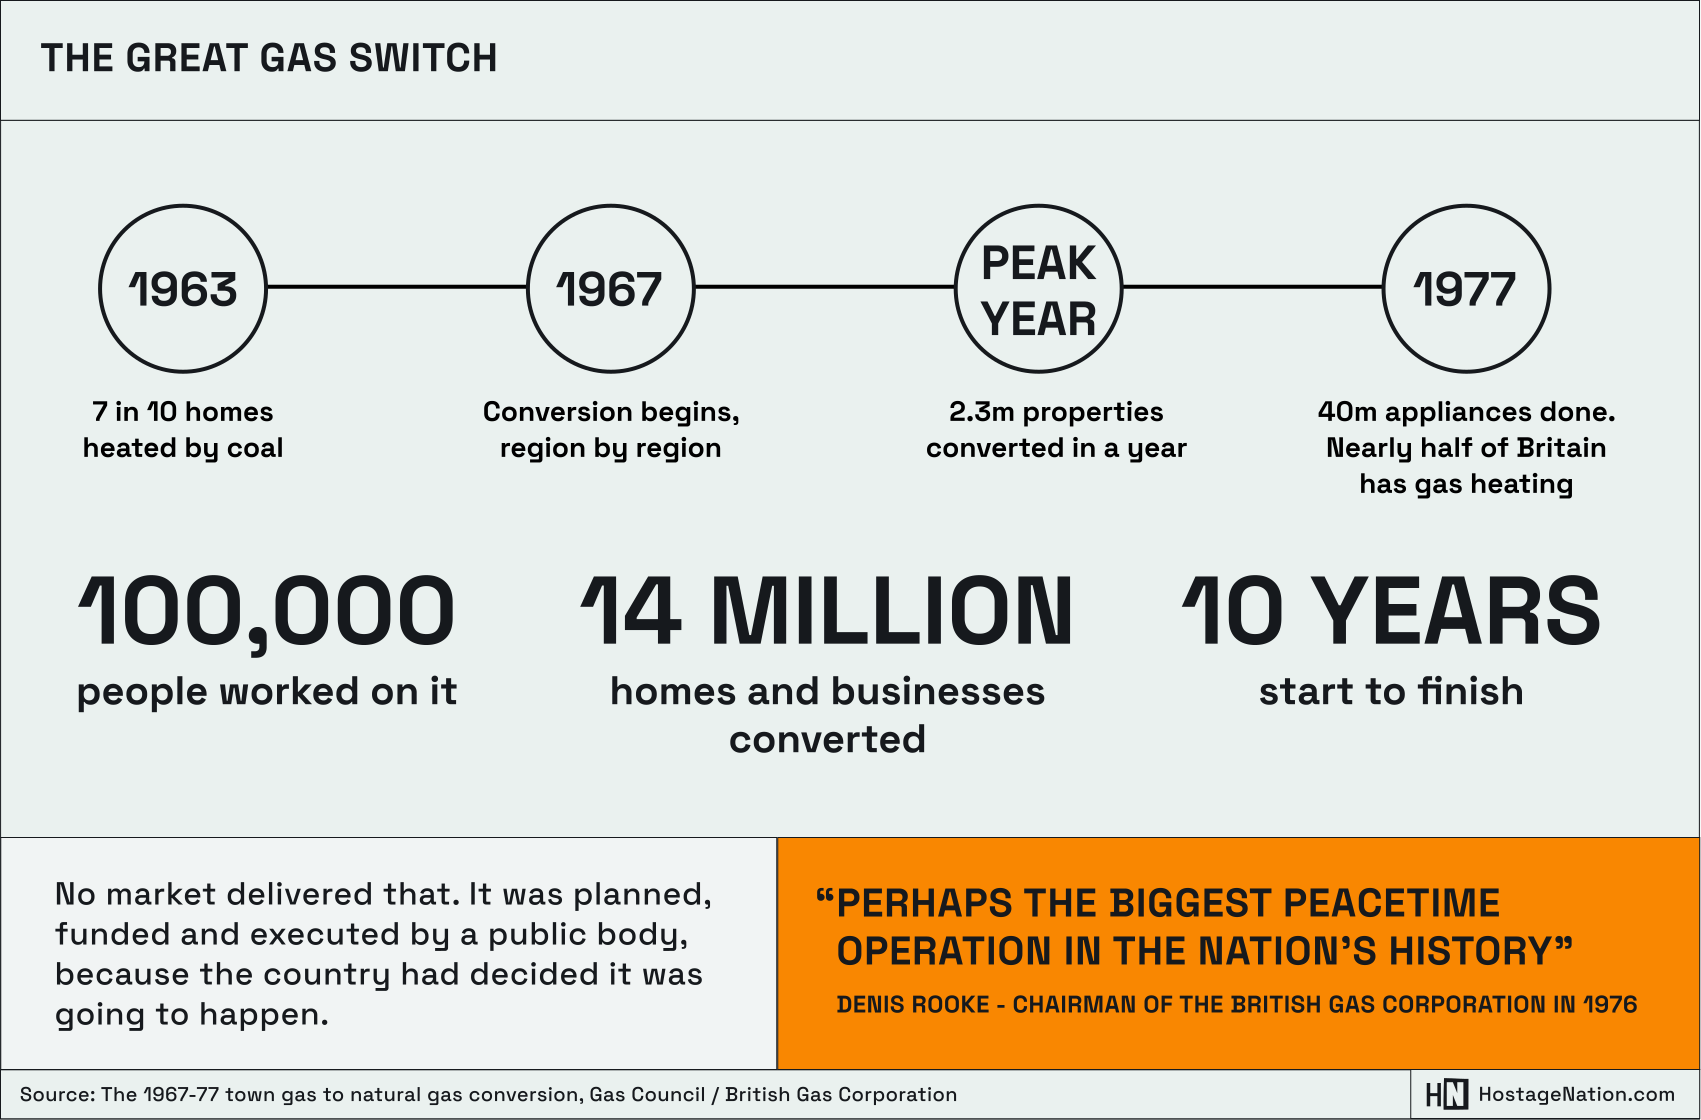
Text description of the great gas switch
Timeline:
- 1963: 7 in 10 homes heated by coal
- 1967: conversion begins, region by region
- Peak year: 2.3m properties converted in a year
- 1977: 40m appliances done. Nearly half of Britain has gas heating
The totals: 100,000 people worked on it; 14 million homes and businesses converted; 10 years start to finish.
The point made: no market delivered that. It was planned, funded and executed by a public body, because the country had decided it was going to happen. Denis Rooke, chairman of the British Gas Corporation in 1976, called it “perhaps the biggest peacetime operation in the nation’s history”.
Source: the 1967 to 77 town gas to natural gas conversion, Gas Council / British Gas Corporation.
No market delivered that. It was planned, funded and executed by a public body, because the country had decided it was going to happen.
Your kitchen table
Under the cap this summer, a typical household pays £1,862 a year: £914 for electricity, £949 for gas.
Now run the same house through this programme. Insulate it, so it needs forty per cent less heat. Take the gas out. Fit a heat pump, which delivers roughly three units of heat for every unit of electricity it draws. Then buy that electricity at what it costs to generate and deliver, rather than at the price of the last gas plant to come online.
The bill comes to around £611. Same house. Warmer. A third of the price.
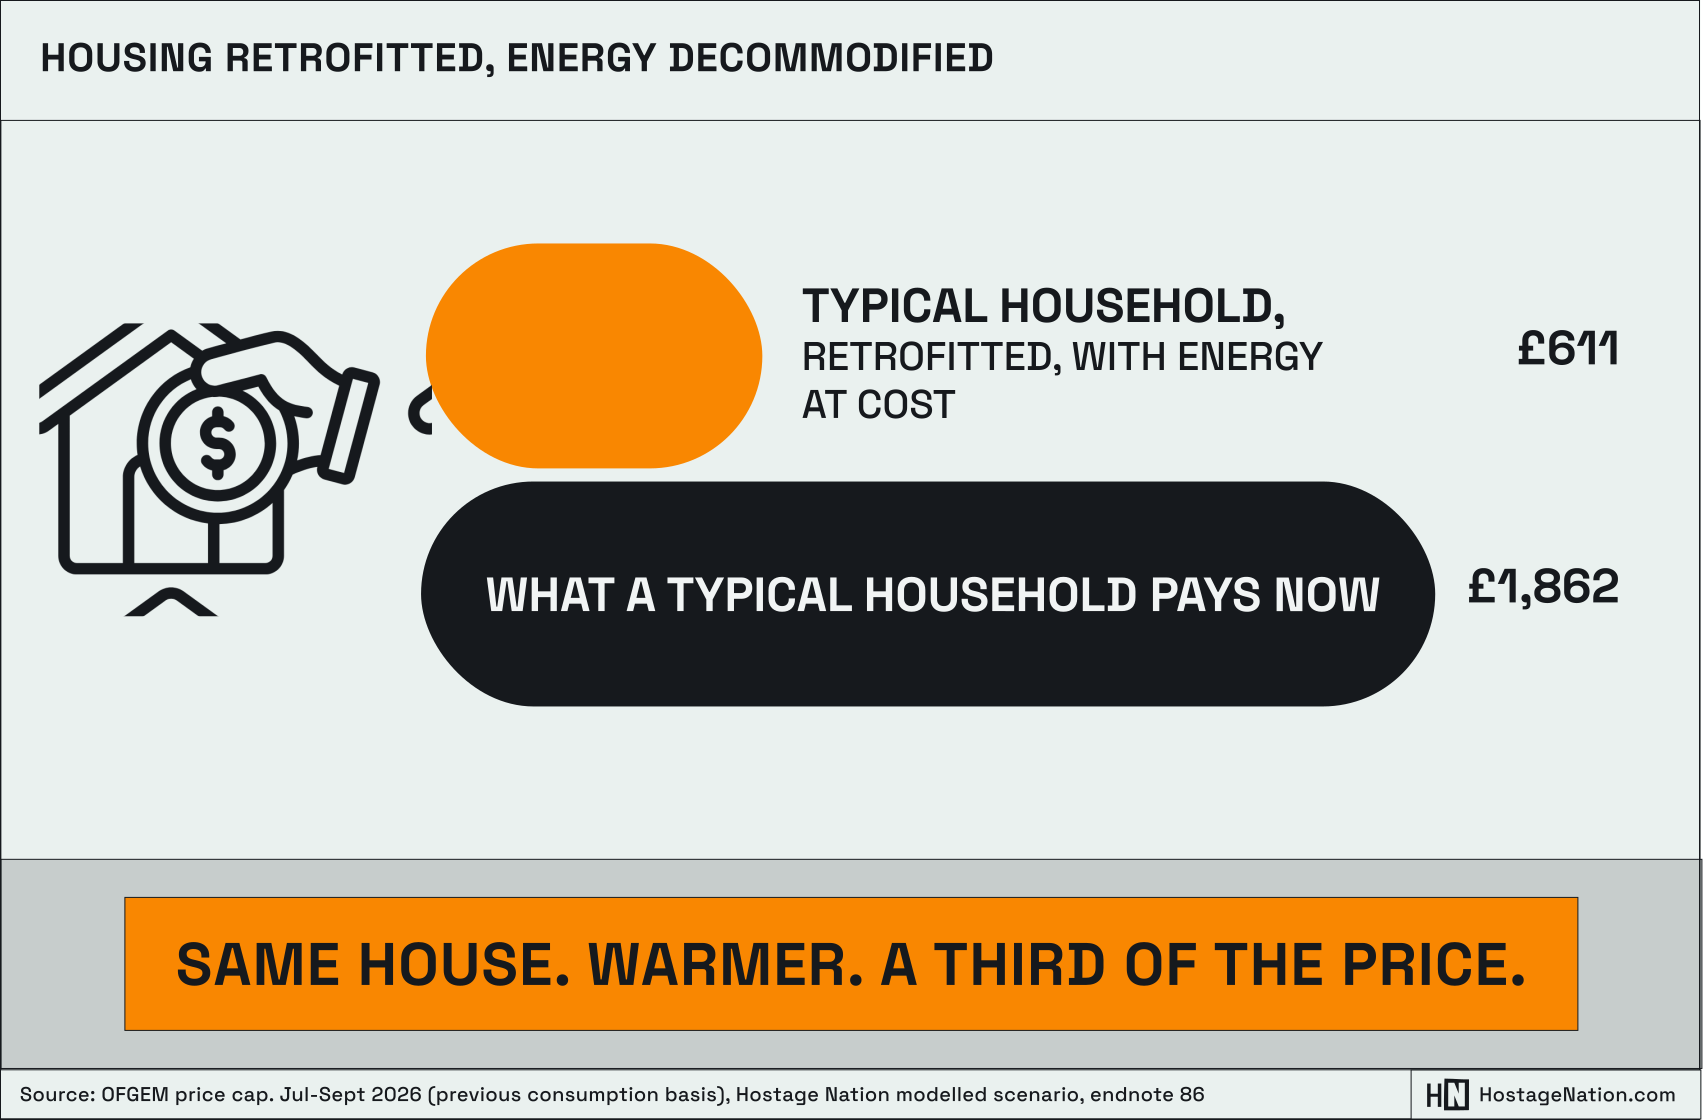
Not a discount, a rebate, or a payment timed for an election. Waste engineered out of a system. For a typical household, about £1,250 a year, every year, permanently.12
That number assumes a decision to sell at cost. A government might decide otherwise – to fund a social tariff for the households that need one, or to return something to the Treasury.13 Those are choices about who gets the benefit. None of them is a reason the electricity has to cost what it costs now.
Energy is the input to everything else. Every factory, every hospital, every home. Get it cheap, clean and domestic, and the rest of this report becomes affordable almost as a side effect. Get it wrong, and nothing else compensates.
What it does to the air
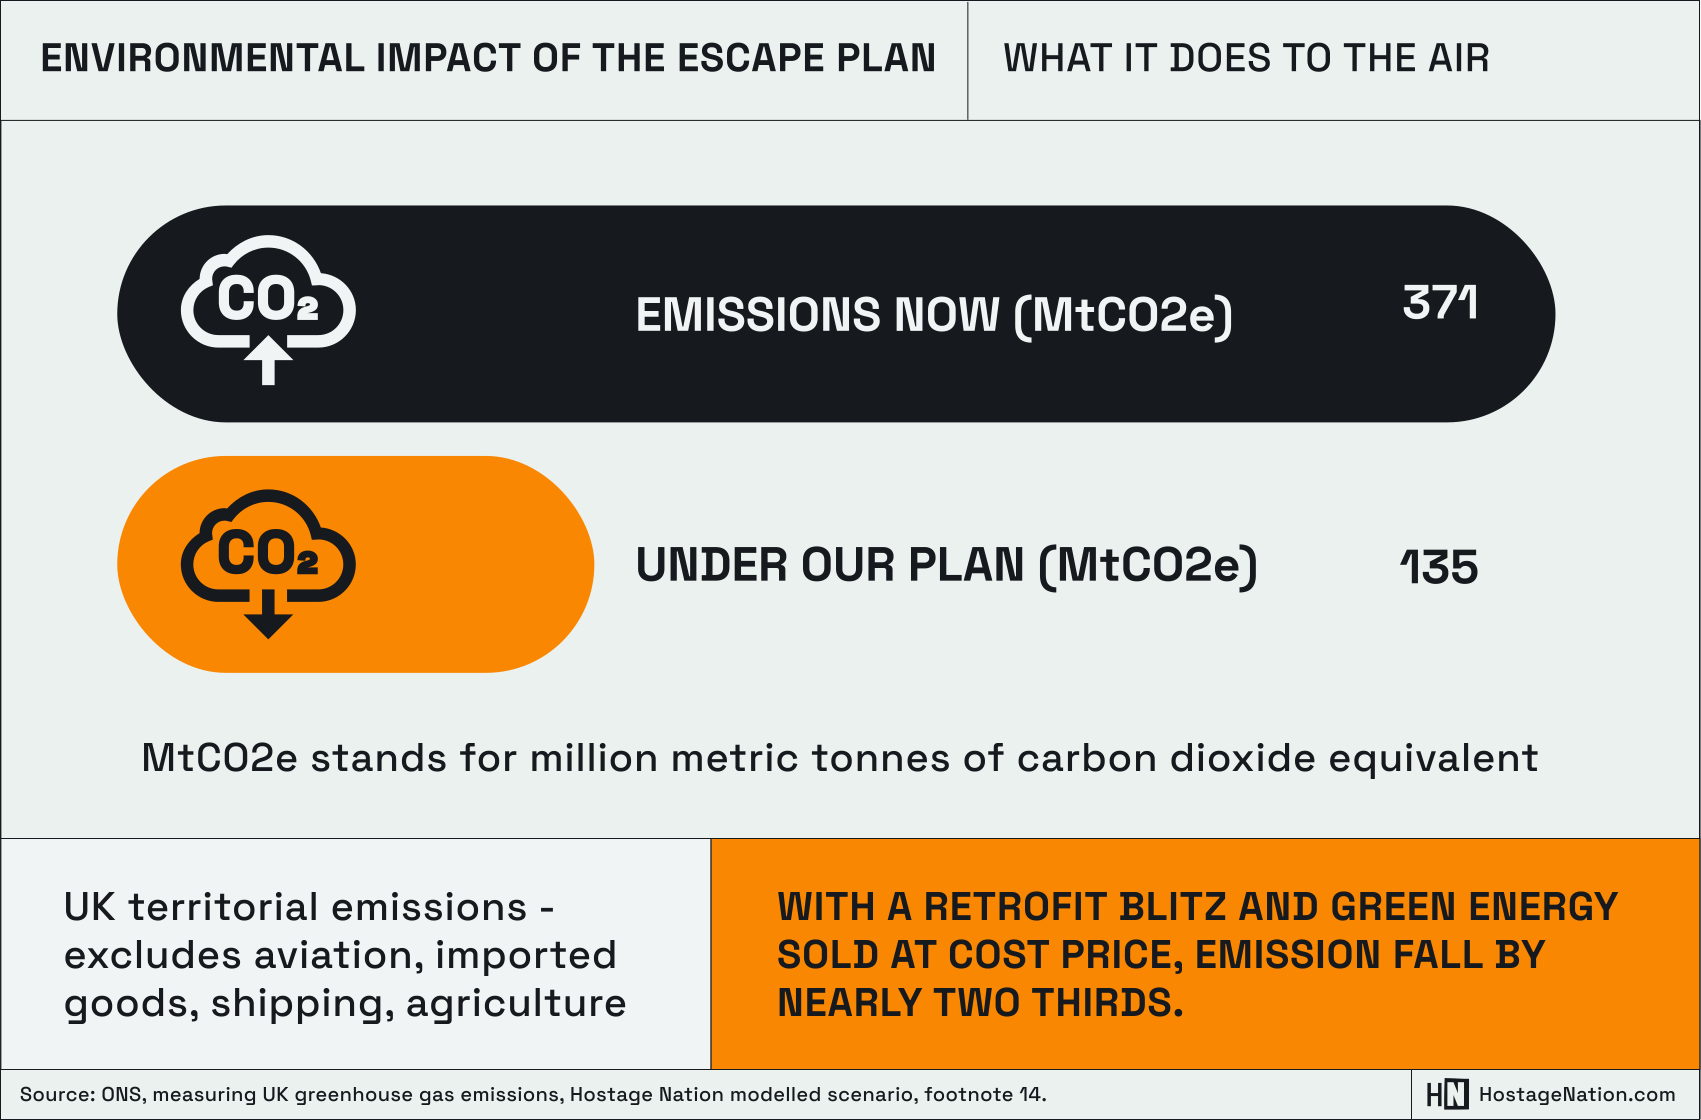
Do all of this and Britain’s territorial emissions fall by something close to two thirds.14
This is not a sacrifice, or a cost incurred for the sake of a target. It is a direct physical effect of insulating houses, building a power grid we own, and replacing imported gas. It is cheaper to save energy than to heat the sky.
This matters beyond the arithmetic. UK climate policy has vacillated. An announcement made, then cancelled a few years later. Often because it has been framed around paying more now for a benefit somewhere down the line. That’s a hard policy to maintain across a change of government. A programme that cuts emissions by cutting bills does not depend on anyone’s goodwill surviving an election.15
“The cheapest way to heat a house turns out to be the fastest way to decarbonise a country. That is not a coincidence. Both problems have the same cause, which is burning gas we have to buy from somewhere else.”
Footnotes
- Department for Energy Security and Net Zero, Electricity Generation Costs 2025, published January 2026. Central levelised cost estimates for projects commissioning in 2035, in 2024 prices: large-scale solar PV £44/MWh (range £36–50), onshore wind £41/MWh (range £33–55), fixed offshore wind £59/MWh (range £50–72), floating offshore wind £91/MWh (range £65–121). Hurdle rates, being the minimum internal rate of return required for a project to proceed, are assumed at 6.5–8.9% for solar and onshore wind (central 7.6%), 7.3–10.6% for fixed offshore wind (central 8.9%) and 9.6–13.3% for floating offshore wind (central 10.1%). DESNZ commissioned CEPA to review hurdle rates across thirty power sector technologies and reports a general increase of one to two percentage points on the previous research. The report states that technologies with high upfront capital costs and relatively low operating costs — it names nuclear, fixed offshore wind and solar PV — are particularly sensitive to hurdle rates, because a higher rate sharply reduces the present value of future generation while leaving the initial capital cost relatively unchanged. Note that levelised costs are estimates for a generic plant, exclude land costs, and exclude wider system costs such as transmission, balancing and storage. The retail unit rate of 26.11p per kWh is the Ofgem price cap for electricity, 1 July to 30 September 2026, direct debit customers, including VAT. ↩︎
- House of Commons Library, What costs make up an electricity bill?, CBP-10505, July 2026, drawing on Ofgem price cap data. Under the April to June 2026 cap, the typical direct debit electricity bill was £875, of which wholesale costs were £333 (38%) and network infrastructure charges £214 (23%), the balance comprising balancing services, policy costs, supplier operating costs, metering, bad debt and VAT. Ofgem reports that wholesale costs rose to around 45% of the cap in the July to September 2026 period following the increase in gas prices. On the April 2026 change: Ofgem, Changes to energy price cap between 1 April and 30 June 2026, records that funding for two environmental and social schemes either ended or moved to general taxation from April 2026, saving customers an average of £150, while network costs rose £66 under the RIIO-3 price control. ↩︎
- Network charges are a genuine cost of a genuine asset, and the network requires substantial expansion to carry the generation described in this chapter. The question raised here is the rate of return earned on regulated monopoly assets and the destination of that return, which is dealt with in the chapter on public ownership. ↩︎
- Marginal pricing sets the wholesale price in each half-hourly settlement period at the cost of the most expensive unit of generation required to meet demand. Gas plant sets that price in a large majority of periods. The Energy and Climate Intelligence Unit estimates that existing wind generation reduced the wholesale price by up to a quarter in 2024, around £25/MWh, by displacing gas plant from the merit order — an effect that operates within the existing pricing rule rather than replacing it. Reform options, including zonal or locational pricing, are contested within the industry: proponents argue they would reduce constraint costs and locate generation more efficiently, while generators and investors argue they would raise the cost of capital by introducing revenue uncertainty. This report takes no position on which reform is preferable, only that the current rule is a design choice rather than a physical constraint. ↩︎
- The scale of the required return is published by the government itself. The Department for Energy Security and Net Zero assumes a hurdle rate — the minimum internal rate of return needed before a project proceeds — of 8.9% for fixed offshore wind, 7.6% for onshore wind and large-scale solar, and 10.1% for floating offshore wind. Those rates rose by one to two percentage points at the most recent review, which covered thirty power sector technologies. The department is explicit about the consequence: technologies with high upfront capital costs and low running costs are the most sensitive to hurdle rates, because a higher rate sharply reduces the present value of thirty years of future generation while leaving the construction bill unchanged. What that produces is visible in the government’s own auctions. In January 2026, contracts for 8.4 GW of offshore wind cleared at £91.20 per megawatt hour in 2024 prices. Solar followed in February at £65 and onshore wind at £72.24. Strike prices are conventionally announced in 2012 prices — offshore wind was reported as £65.45 — which understates them against current money by roughly a third. Three points of fairness. The developers are not overcharging: separate analyses by Aurora Energy Research and Baringa found that an offshore wind strike price of around £94 would have been cost-neutral to bill payers, and the auction cleared below it. The Contract for Difference is a two-way instrument, under which generators pay money back when market prices exceed the strike price, as they did during the gas price spike; it is a price stabiliser, not a one-way subsidy, and it is not the mechanism criticised here. And the department states that its levelised cost estimates should not be read as a direct guide to strike prices, since auction prices also reflect revenue assumptions, transmission losses, route-to-market discounts, decommissioning and contract terms. Nor is any of this a criticism of investors, who are behaving rationally. Capital is allocated to whichever use offers the best risk-adjusted return, and a wind farm in the North Sea has to outbid every other claim on the same money. The observation made here is simply that a state financing the same asset is not in that auction, and does not have to pay what winning it costs. On the 40% figure, see the endnote to Chapter 19. Sources: DESNZ, Electricity Generation Costs 2025, January 2026; DESNZ, Contracts for Difference Allocation Round 7 results, January 2026, and Allocation Round 7a results, February 2026; Energy UK. ↩︎
- National Energy System Operator, Future Energy Scenarios: Pathways to Net Zero 2025, July 2025. Electricity demand in Great Britain is approximately 290 TWh at present, rising to between 705 and 797 TWh by 2050 across three net zero pathways, with generation of 757 to 822 TWh. UK electricity consumption, which includes Northern Ireland, is approximately 322 TWh. FES 2025 raised its 2050 demand projection by up to 17% against FES 2024, attributed in part to faster electrification and in part to lower assumptions about energy efficiency. NESO pathways are explicitly scenarios rather than forecasts, and are constructed against current policy rather than against what policy could be. The figure of 580 TWh is the author’s own estimate and not a modelled projection. It is the upper end of a range of roughly 540 to 580, taken deliberately, and is set against a comparably constructed official figure of around 820. Its components: around 250 TWh of useful domestic heat, cut by half through fabric retrofit and delivered at a seasonal performance factor of 3.5, requires around 36 TWh of electricity against around 85 TWh unretrofitted; Great Britain’s 412 billion car-kilometres, reduced by 60% and replaced by a public transport network operated at London bus frequencies nationally, require around 53 TWh against around 94 TWh on the official baseline; the remainder assumes direct electrification in place of a large hydrogen economy, together with efficiency in industry and in existing loads. Two qualifications are material. Most of the collapse in heat demand comes from the coefficient of performance of the heat pump rather than from the insulation: halving the heat demand of a house that already has a heat pump saves around 48 TWh nationally, which is a large number but a smaller one than the framing in the text implies. And the electricity saving from modal shift saturates — a 60% cut in car-kilometres saves only around 24 TWh more than a 30% cut, because the network carrying the displaced journeys must itself be run — so the case for modal shift made in Chapter 25 rests on avoided vehicles, road capacity and network reinforcement rather than on terawatt hours. Against that, the official pathways assume movement in the opposite direction: the Climate Change Committee’s Seventh Carbon Budget assumes that the lower running cost of electric cars raises car-kilometres by more than modal shift reduces them, and identifies the resulting rebound as something to monitor rather than to prevent. All figures are final consumption rather than primary energy, on both sides of the comparison. Sources: NESO, FES 2025; Climate Change Committee, The Seventh Carbon Budget, February 2025; DESNZ, Energy Consumption in the UK 2025; DfT, Road traffic estimates in Great Britain 2024 and Annual bus statistics, year ending March 2025; Energy Systems Catapult, Electrification of Heat Demonstration Project, which found a median seasonal performance factor of 2.80 in 742 installed systems. ↩︎
- This chapter does not attempt a design for the British electricity system. New nuclear, small modular reactors, tidal, hydro and interconnection all have serious advocates and serious literatures, and the technology is moving quickly. This is a report about economics, not about engineering. The illustration given here is intended to convey the scale and character of the task to a general reader, not to specify a generating mix. ↩︎
- Constraint payments arise where transmission capacity is insufficient to move generation from where it is produced to where it is needed, principally across the B6 boundary between Scotland and England. Total constraint costs in 2025 were approximately £1.35–1.5 billion, comprising roughly £350–380 million paid to wind generators to reduce output and roughly £1 billion for replacement generation, predominantly gas. Comparable costs in 2020 were around £282 million against 3.8 TWh of curtailed wind. NESO forecasts that constraint costs could reach approximately £8 billion a year by 2030 absent network reinforcement, and would remain between £2.8 and £3.7 billion a year even with the planned upgrades delivered. Figures should be verified against NESO’s published Monthly Balancing Services Summary before publication, as they are revised. ↩︎
- Technology readiness. Lithium-ion battery storage is fully commercial and deployed at grid scale across Great Britain. Sodium-ion is at technology readiness level 7 to 8, with multi-gigawatt manufacturing capacity commissioned and cell costs at or near parity with lithium iron phosphate; round-trip efficiency is 80–90% against 85–95% for lithium-ion, a difference immaterial for stationary storage. Iron-air batteries are in early commercial deployment, with round-trip efficiency of 40–50% and target capital costs an order of magnitude below utility-scale lithium-ion; the efficiency penalty is economically acceptable where the input is otherwise-curtailed generation. Green hydrogen round-trip efficiency, accounting for electrolysis, compression and regeneration, is approximately 30–35%; it is appropriate only for seasonal storage and as an industrial feedstock. Ofgem operates a cap and floor revenue support scheme for long-duration electricity storage. Separately, perovskite-silicon tandem photovoltaic cells, developed substantially in Britain, offer efficiencies materially above conventional silicon and represent a manufacturing opportunity the UK is well placed to take. ↩︎
- The distribution of cost within a domestic solar installation is heavily weighted towards labour and local services rather than hardware. Panels themselves represent a minority of installed cost at prevailing global module prices; the balance is surveying, scaffolding, roofing, electrical work, inverters, mounting, freight and administration. Figures vary by installation type and should be treated as indicative. China holds over 90% of global polysilicon and wafer capacity, with global manufacturing capacity substantially exceeding global annual installation, which sustains low module prices. ↩︎
- The conversion of Great Britain from town gas to North Sea natural gas ran from 1967 to 1977, converting or replacing approximately 40 million domestic appliances for around 14 million customers, at a peak rate of approximately 2.3 million properties a year, employing in the order of 100,000 people, at a reported cost of approximately £600 million. The programme was planned and delivered by the Gas Council and subsequently the British Gas Corporation, both publicly owned, working region by region in step with the expansion of the high-pressure grid. Households were surveyed in advance and appliances repaired, converted or replaced. Sir Denis Rooke, chairman of British Gas from 1976 to 1989, described it as perhaps the greatest peacetime operation in the nation’s history. In 1963 around 70% of UK homes were heated by coal; by 1977 nearly half had natural gas central heating. ↩︎
- The £611 figure is the author’s own calculation rather than a figure taken from a published report. The assumptions are set out here so that readers can test them. Baseline, Ofgem price cap for July to September 2026: electricity 2,700 kWh at 26.11p plus £209 standing charge, £914; gas 11,500 kWh at 7.33p plus £106 standing charge, £949; total £1,862. A note on that baseline. From 1 July 2026 Ofgem reduced its Typical Domestic Consumption Values to 2,500 kWh of electricity and 9,500 kWh of gas, which restates the same cap as £1,663. No household’s consumption changed. The figures used here are on the previous consumption values, which permit like-for-like comparison with what households have actually been paying, and the proportionate reduction is unaffected by which basis is used. Modelled scenario: insulation reduces heat demand by 40%, taking 11,500 kWh of gas-equivalent thermal demand to 6,900 kWh. A heat pump with a seasonal coefficient of performance of 3.2 meets that with 2,156 kWh of electricity. Adding unchanged appliance and lighting demand of 2,700 kWh gives total electricity demand of about 4,850 kWh. Priced at 12.6p per kWh — a blend of renewable generation costs with network and distribution costs, assuming networks in public ownership and network costs recovered through the unit price rather than a separate standing charge — the annual bill is approximately £611. VAT on domestic electricity falls from 5% to zero from 1 October 2026, worth around £45 a year against the current bill. That change is not assumed in the modelled scenario, and is a further reduction on the baseline rather than on the modelled figure. The result is sensitive to its inputs. A heat pump coefficient of 3.0 rather than 3.5 moves the total by around £40. A retrofit achieving 30% rather than 50% demand reduction moves it by around £150. An electricity price of 10p rather than 15p per kWh moves it by £150 to £250. The plausible range is therefore roughly £450 to £900 — a substantial reduction on £1,862 in every case, but the central figure should be read as an indication of the scale of the prize rather than a precise forecast. Input sources: Ofgem price cap; household consumption via industry averages; CfD strike prices via Energy UK, Allocation Round 7 and 7a results, and Carbon Brief. ↩︎
- Selling at cost is a policy choice, not an automatic consequence of public ownership. A publicly owned system could price above cost in order to fund a discounted social tariff for low-income households, to build a capital reserve for network expansion, or to return a surplus to the Exchequer. Each of those is a decision about distribution, and each has a respectable case. The claim made in this chapter is narrower: that the current price bears little relation to the cost of production, and that the difference is largely the product of the pricing rule and the cost of capital rather than of any physical constraint. What is done with the difference is a separate question. This report does not address the related question of who should receive the benefit of rooftop microgeneration — householder, landlord or public body — which raises issues of property and tenure beyond its scope. ↩︎
- UK territorial greenhouse gas emissions were 371 MtCO2e in 2024 (ONS, Measuring UK greenhouse gas emissions, drawing on DESNZ). The UK’s consumption footprint, which includes emissions embodied in imported goods, was 699 MtCO2e in 2023, or approximately 10 tonnes per person (Defra, Carbon footprint for the UK and England to 2023). Of that ten tonnes, roughly 5.4 arises within UK borders and roughly 4.6 from imports and international travel. The estimated reduction to around 135 MtCO2e, approximately 63%, is the author’s own calculation of the combined effect of decarbonised electricity, electrified heat and electrified surface transport, and is not taken from a published projection. It excludes agriculture, aviation, shipping, industrial process emissions and imported goods. Reducing imports through domestic manufacture powered by zero-carbon electricity would reduce the footprint figure further, but that analysis is beyond the scope of this report. ↩︎
- Examples of reversal are readily available and span successive governments of different parties, which is the point: the pattern is structural rather than partisan. In 2006 the Code for Sustainable Homes was introduced alongside a commitment that all new homes would be zero carbon from 2016. The Code was withdrawn by Written Ministerial Statement on 25 March 2015 following the Housing Standards Review, and the zero carbon homes requirement itself was scrapped in the Productivity Plan published alongside the July 2015 Budget, roughly nine months before it was due to take effect. An amendment to reinstate it was narrowly defeated during the passage of the Housing and Planning Bill in May 2016. Housebuilders had by then spent a decade preparing to meet it. The Energy and Climate Intelligence Unit estimated that the cancellation would cost households as much as £1 billion in avoidable energy use by the end of 2020, with occupants of affected new homes paying up to £200 a year more than they would otherwise have done; that estimate runs only to 2020, and the homes built to the lower standard since then continue to accrue the cost. The date for ending sales of new petrol and diesel cars has moved four times in eight years: announced as 2040 in 2017, brought forward to 2030 in the Ten Point Plan of November 2020, pushed back to 2035 in September 2023, and restored to 2030 in April 2025. Feed-in Tariffs, introduced in April 2010, were cut in a fast-track review in 2011, reduced by around two thirds for domestic solar from January 2016, and closed to new applicants on 31 March 2019; the UK solar installation industry contracted sharply over that period. The Green Homes Grant was announced in July 2020 with an initial £1.5 billion for domestic retrofit and closed to new applications on 31 March 2021, six months after it opened. The National Audit Office found that it was expected to spend £314 million of the £1.5 billion available, upgrading around 47,500 homes against an initial expectation of 600,000 and supporting some 5,600 jobs against an expectation of 82,500. The £1 billion carbon capture and storage commercialisation competition, launched in 2012, was cancelled in November 2015 shortly before contracts were due to be awarded, after bidders had incurred substantial development costs. In each case the announcement created an investment signal, firms responded to it, and the signal was then withdrawn. The cost falls not only on the emissions foregone but on the supply chain that geared up and then stood down — which is why a programme whose durability rests on lower bills rather than on continuing political commitment is a different proposition. ↩︎